1. Introduction: IB & FRVP
Initial Balance (IB) and the Fixed Range Volume Profile (FRVP) can provide a crucial market context and volume insights. Ever feel like the first hour of trading index futures is pure chaos? Whether you’re watching Nifty Futures, Bank Nifty, or perhaps the US minis like the ES, that opening bell often unleashes a wave of volatility. Consequently, it can leave you feeling whipsawed and uncertain. So, how do you cut through that noise and find reliable levels to trade off?
Fortunately, there are a couple of powerful tools that can act as your anchors in that early market storm: the Initial Balance (IB) and the Fixed Range Volume Profile (FRVP). These aren’t just abstract theories; indeed, they are versatile, practical tools you can use right on your charts. They help you see where the market is placing its bets and finding value. Specifically, IB provides crucial context based on the opening hour’s activity. Meanwhile, FRVP allows you to dissect volume distribution within specific price ranges, revealing hidden areas of support, resistance, and value.
In this post, I’m going to walk you through a practical intraday strategy. It cleverly combines these two tools, designed specifically for trading index futures. Therefore, if you’re trying to navigate the intraday swings of instruments like Nifty Futures, Bank Nifty Futures, or even global indices, understanding how IB and FRVP work together could genuinely be a game-changer for your approach.
Ready? Let’s dive in and learn how you can leverage volume and the opening range for more informed index trading.
2. Decoding the Initial Balance (IB)

Think of the Initial Balance (IB) as the market’s opening statement for the day. It’s all about understanding the story told by that critical first hour of trading.
What Exactly is Initial Balance?
Simply put, the IB is the price range – specifically, the highest high and lowest low – established during the first 60 minutes of the main trading session. For Indian markets like Nifty and Bank Nifty, this typically means the 9:15 AM to 10:15 AM IST window. For other global indices, it corresponds to the first hour after their respective cash market opens. Now, why is this hour so crucial? It’s often when the larger players, the institutions, make their initial moves. Furthermore, it represents the market’s first real attempt to establish what might be a ‘fair’ price for the day. Essentially, this period sets the stage for subsequent action.
Finding the IBH and IBL on Your Chart
Spotting the IB on your chart is quite straightforward. First, pull up your preferred timeframe (5min,15min chart usually works well). Then, focus solely on that first hour of trading activity.
- Identify the highest price point reached during that hour. That’s your Initial Balance High (IBH).
- Similarly, find the lowest price point reached. That’s your Initial Balance Low (IBL). You’ll want to mark these two levels clearly, as they often become significant reference points throughout the trading day. [Chart Example Placeholder: IB High and Low marked clearly on an Index Futures chart.]
What the IB Range Width Tells You
The distance between the IBH and IBL, often called the IB range width, offers valuable clues about the market’s personality for the day:
Narrow IB Range:
When the high and low are relatively close, it often signals some initial indecision or balance. Perhaps participation is low, or buyers and sellers are in temporary agreement. Consequently, this can sometimes mean energy is building up for a more significant directional move (a potential breakout) later in the session.
Wide IB Range:
Conversely, if the first hour involves a lot of price movement and volatility, creating a wide range, it usually indicates strong conviction or significant disagreement on value right from the start. On days like these, the IBH and IBL might act as strong containing levels for much of the session. Alternatively, a wide range can set a strong directional bias if the price consistently holds above or below the IB midpoint.
Know Your Index:
Remember, context matters. What looks like a wide range on Nifty Futures might be fairly standard for the typically more volatile Bank Nifty Futures. Therefore, it’s helpful to get a feel for the average IB size for the specific index future you’re trading.
So, the IB provides our initial map – defining the early boundaries and giving us a sense of the opening sentiment. Next up, let’s add the power of volume analysis.
3. Understanding Fixed Range Volume Profile (FRVP)

Those standard volume bars at the bottom of your chart are useful, for sure. However, they only tell you when volume occurred, not where the heaviest trading took place in terms of price levels. That’s the critical question Volume Profile answers.
Volume Profile: Seeing Where the Action Is
Essentially, Volume Profile flips the script. Instead of plotting volume against time, it plots it against price. Imagine a horizontal histogram displayed on the price axis of your chart. This visualization instantly shows you which price levels attracted the most trading activity and which were largely ignored.
Meet the FRVP: Your Flexible Volume Tool
The Fixed Range Volume Profile (FRVP) is a specific, interactive version of this concept. Unlike profiles automatically calculated for a whole session or what’s visible on screen, the FRVP tool puts you in control. You manually select a starting point and an ending point directly on your chart. Then, the tool calculates and displays the volume distribution only within that precise range you defined. This flexibility is fantastic for analyzing specific price swings, periods of consolidation, or, as we’ll do in our strategy, examining the volume structure relative to the Initial Balance. (Quick reminder: Because it needs real trade data, FRVP works best on index futures or other products with accessible volume information.)
Key Levels to Watch (POC, VA,)
When you apply the FRVP tool, several important reference points will appear. Here’s what you need to focus on:
Point of Control (POC)
This is the single price level within your selected range that had the absolute highest trading volume. It’s the market’s ‘favorite’ price in that zone, representing peak agreement and activity. Consequently, the POC often acts as a strong magnet or a pivotal support/resistance level
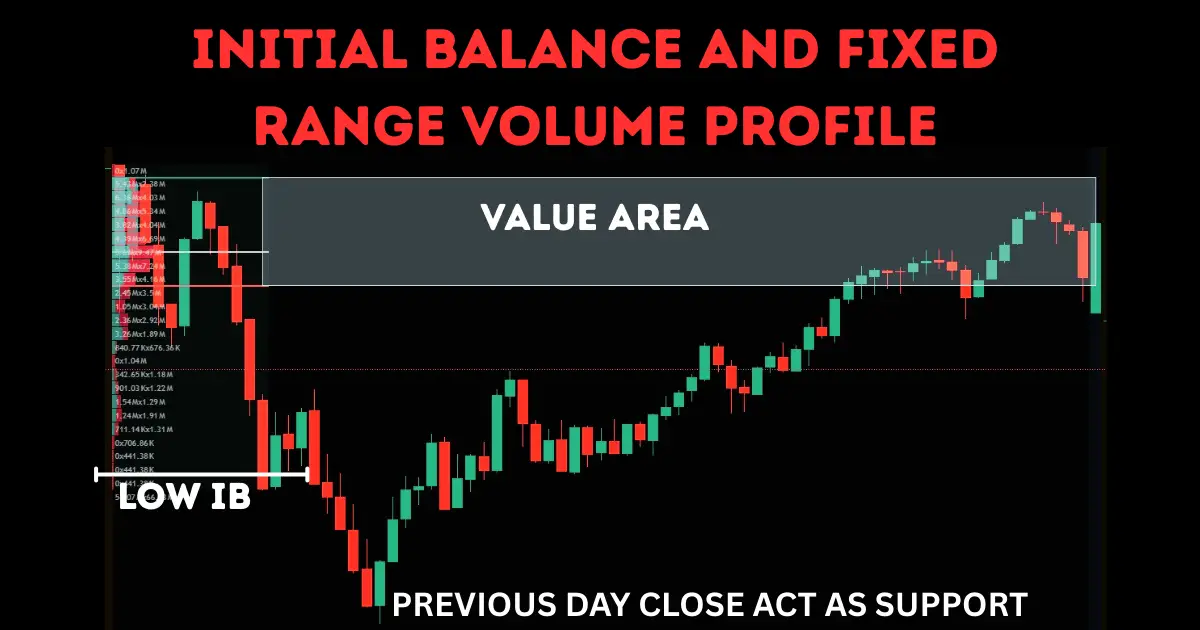
Value Area (VA):
This shaded area highlights the price range where the majority of the volume (usually around 70%, though often adjustable) took place within your selected timeframe. Think of it as the ‘fair ground’ – the zone where the market spent most of its time and accepted price as reasonable during that period
Value Area High (VAH) & Value Area Low (VAL):
These are simply the upper and lower boundaries of the Value Area. They are crucial levels to watch, often acting as significant dynamic support (VAL) and resistance (VAH). Price moving decisively outside the VA can indicate a shift in the market’s perception of value.
Alright, now that we’ve got a solid understanding of both Initial Balance and the Fixed Range Volume Profile, let’s finally combine them into a practical trading strategy…
4.The IB & FRVP Index Futures Trading Strategy
Core Concept:
The real edge here comes from combining the time-based context of the Initial Balance with the detailed volume information provided by the Fixed Range Volume Profile. IB tells us when and where the early battle lines were drawn, while FRVP shows us how much firepower (volume) was committed at specific price levels within key areas, helping us gauge the strength of support, resistance, and potential moves. We’re essentially layering volume confirmation onto the key IB reference points for trading index futures.
Clarification:
Why Index Futures? It’s crucial to remember that Volume Profile analysis relies on actual traded volume. Spot indices (like Nifty 50 or Bank Nifty cash indices) don’t have direct volume. Therefore, this strategy is designed for index futures (like Nifty Futures, Bank Nifty Futures, FINNIFTY Futures, E-mini S&P 500, etc.) or highly liquid Index ETFs where reliable volume data is readily available.
Applying FRVP with IB
How do we specifically use the FRVP tool in conjunction with the IB levels (IBH & IBL)? Here are a couple of primary ways:
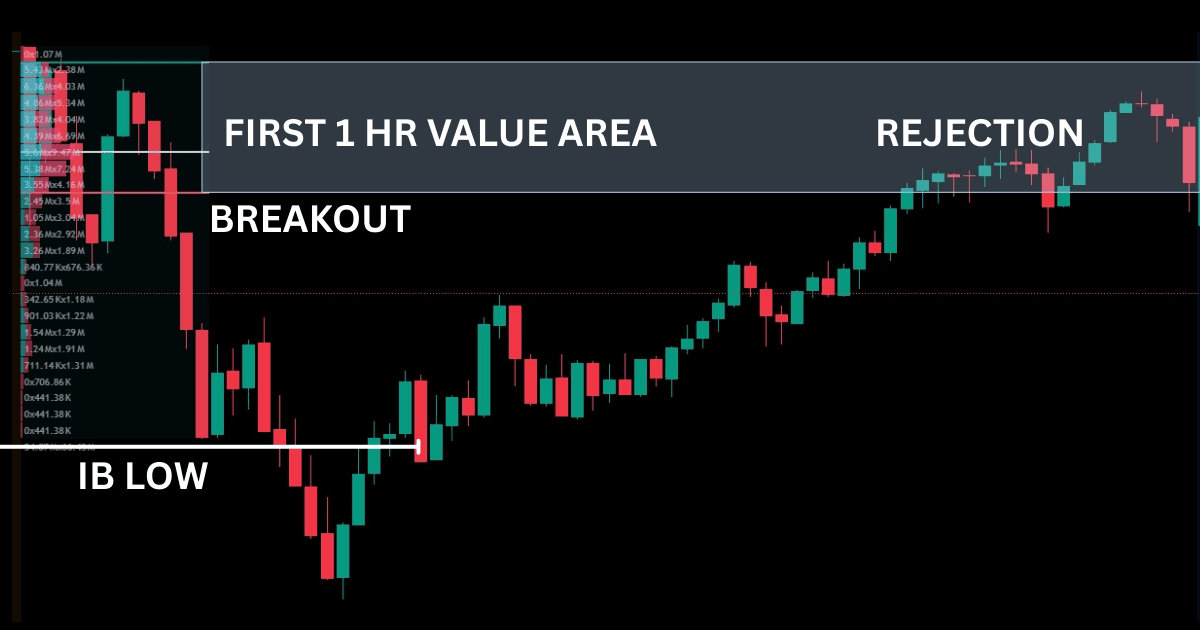
Method 1: Profiling the Initial Balance Range:
Once the first hour (IB) is complete, draw the FRVP tool precisely from the IB Low to the IB High, covering only that first hour’s price action.
Purpose: This shows you the volume distribution within the opening range. Pay close attention to where the POC (Point of Control) and Value Area (VAH/VAL) formed inside the IB. A POC near the IBH might suggest sellers were active there, while a POC near IBL suggests buyer interest. This helps gauge internal strength or weakness and identify key support/resistance within the IB itself.
Method 2: Profiling Post-IB Price Swings:
Wait for price to move significantly after the IB is established (e.g., a clear breakout above IBH or below IBL, or a significant rotation back towards an IB level).
Draw the FRVP tool over that specific price swing (e.g., from the start of the breakout move to its current pause/high, or over a consolidation period near an IB level).
Purpose: This helps analyze the volume driving the current move. Is volume supporting the breakout?
Method 3: Using Previous Day’s Profile:
Keep the previous day’s Volume Profile (Session VP or a full-day FRVP) on your chart for context.
Purpose: See if the current day’s IBH or IBL lines up with significant levels from the prior day (like POC, VAH, VAL). When levels line up like this, they become much more significant potential turning points or breakout zones.
5.IB & FRVP Trading Setups for Index Futures
Strategy Setup Example: Trading the IB & FRVP Breakout
This specific setup focuses on capturing moves after the price breaks out of the Initial Balance, particularly on days where the IB range itself wasn’t excessively wide.
Conditions and Initial Setup
First, establish your baseline right after the initial hour concludes. You’ll need to mark the Initial Balance High (IBH) and Initial Balance Low (IBL). Concurrently, apply the Fixed Range Volume Profile (FRVP) specifically across this first-hour range (IBL to IBH) and note the resulting VAH, VAL, and POC. Remember, this breakout strategy tends to perform better when the IB range is narrow or moderate relative to the index’s usual daily movement – this acts as our primary filter. Finally, before hunting for trades, identify and mark key support and resistance levels from the previous trading day, as these often serve as logical profit targets.
Identifying the Breakout & Confirmation
Now, exercise patience and wait for the market to make a decisive move. You are looking for a clear candle close outside the established IB range – either above IBH for a long opportunity or below IBL for a short one. Once you see a potential breakout candle, look for confirmation. Check the standard volume histogram at the bottom of your chart; ideally, the breakout should occur on significantly higher volume than the recent average, indicating conviction. While secondary, you can also note if the breakout is slicing through an LVN from the IB profile, suggesting an easier path.
Entry Rules
With a confirmed breakout, you have a couple of options for entry. For a long entry (break above IBH + volume), the more aggressive approach is to enter on the close of the breakout candle itself. A more conservative entry waits for a potential pullback towards the broken IBH level and enters long only if that level holds as new support. Similarly, for a short entry (break below IBL + volume), you can enter on the breakout candle’s close or wait for a pullback to the broken IBL, entering short if it acts as resistance.
Take Profit Strategy
For taking profits on these breakout trades, focus primarily on the external levels identified earlier. Your main targets should be those significant support or resistance levels derived from the previous day’s price action or volume profile. As price approaches these key zones, consider securing at least partial profits.
Stop-Loss Strategy
Effective risk management is paramount, so define your stop-loss before entering. When trading these IB breakouts (especially on narrow/moderate IB days), a logical placement often relates to the Value Area derived from the IB’s own profile. For long trades, consider placing the stop below the Value Area Low (VAL) of the IB profile. For short trades, the stop could go above the Value Area High (VAH) of the IB profile. The thinking here is that a failure that pushes price back through the entire initial value zone often negates the breakout idea. Alternatively, if you entered on a pullback, placing the stop just beyond the low of the pullback (for longs) or above the high of the pullback (for shorts) is also a valid technique, ensuring it’s past the initial IBH/IBL breakout level.
Important Disclaimer:
The information provided in this blog post, including any strategies, examples, or analysis related to Initial Balance (IB) and Fixed Range Volume Profile (FRVP) for trading indices or index futures, is strictly for educational and informational purposes only. It does not constitute financial advice, investment advice, trading advice, or any other sort of advice.
Trading financial markets, especially leveraged instruments like index futures, carries a substantial risk of loss. Market conditions can change rapidly, and the strategies discussed may not be suitable for all investors or traders. Past performance, including any backtested results or examples shown, is not indicative of future results. There are no guarantees of profit, and you may lose some or all of your invested capital.
You should not make any trading or investment decisions based solely on the content presented here. Always conduct your own thorough research, understand the risks involved, consider your financial situation and risk tolerance, and consult with a qualified financial advisor or professional before making any trading or investment decisions. You are solely responsible for any trading decisions you make. The author and publisher of this blog post assume no liability for any trading losses or damages incurred as a result of using or relying on the information provided.
Conclusion: Bringing It All Together(IB & FRVP)
So, we’ve explored how combining the Initial Balance (IB) framework with the insights from Fixed Range Volume Profile (FRVP) can offer a more structured approach to intraday index futures trading. By layering volume context onto the day’s opening range, this strategy aims to identify higher-probability zones for potential breakouts or reversals, helping you make more informed decisions amidst market noise.
Remember though, no strategy guarantees success. Diligent practice, thorough backtesting on your specific index future, and disciplined risk management are non-negotiable for navigating the markets effectively. Trading involves significant risk, so always be prepared and keep learning.
Frequently Asked Questions (FAQ) IB & FRVP
1. What exactly is the Initial Balance (IB) again?
The Initial Balance refers to the high and low price range established during the first hour of the main trading session for an index future (like 9:15 AM – 10:15 AM IST for Nifty/Bank Nifty). It represents the market’s initial attempt to establish value for the day and often reflects early institutional activity. The IB High (IBH) and IB Low (IBL) become key reference points.
2. Why is the first hour (IB period) considered important?
This period often sees high volume and participation as traders react to overnight news and establish positions. The price range created during this time gives crucial clues about the day’s potential character – whether it might be trending (if the range is decisively broken) or range-bound (if price stays contained within or frequently revisits the IB range).
3. What’s the main difference between Fixed Range Volume Profile (FRVP) and Session Volume Profile (SVP)?
Both show volume at price. However, Session Volume Profile (SVP) automatically calculates the volume distribution for a fixed session (like the entire trading day). Fixed Range Volume Profile (FRVP) is a manual drawing tool where you select the specific start and end points (both price and time) on the chart for which you want to see the volume profile. This gives FRVP much more flexibility for analyzing specific price swings or periods, like the IB range itself or a breakout move.