Mastering the Relative Strength Index (RSI) indicator for Profitable Trading
Overview
The RSI indicator is a widely used momentum indicator that helps traders determine whether an asset is overbought or oversold. However, RSI is more than just a tool to find potential reversal points. When applied correctly, it can:
- Identify early signs of trend reversals.
- Confirm the strength of an existing trend.
- Improve the accuracy of trade entries and exits.
In this guide, we will break down everything you need to know about RSI, from its calculation to advanced trading strategies.
Introduction: RSI indicator
Many traders struggle with finding the right time to enter or exit a trade. They either buy too early and watch the price drop further or sell too soon and miss out on additional profits.
RSI indicator is a momentum-based technical indicator that helps solve this issue by measuring the speed and strength of price movements. If used correctly, it can help traders:
- Avoid entering trades based on false signals.
- Identify potential trend reversals before they happen.
- Improve their overall trading strategy.
To fully understand how RSI works, we first need to define what it is and how it is calculated.
What is RSI indicator?
RSI, or the Relative Strength Index, is a technical indicator used to measure the momentum of price movements. It oscillates between 0 and 100 and is typically used to identify overbought and oversold conditions in the market.
- When RSI is above 70, the asset is considered overbought, meaning the price may be too high and a correction could occur.
- When RSI is below 30, the asset is considered oversold, meaning the price may be too low and a potential reversal could take place.
However, RSI is not just about identifying overbought and oversold levels. Traders also use it to confirm trends, spot divergences, and make better-informed trading decisions.
4. How is RSI Calculated?
The RSI indicator is calculated by taking the average gain and average loss over a specified number of periods. The default setting is 14 periods, but traders can adjust this based on their trading style.
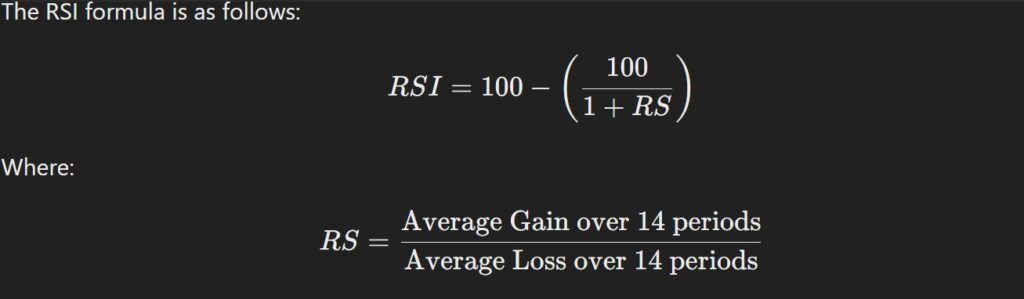
Most trading platforms, such as TradingView, MetaTrader, and ThinkorSwim, automatically calculate RSI, so traders do not need to do the math manually.
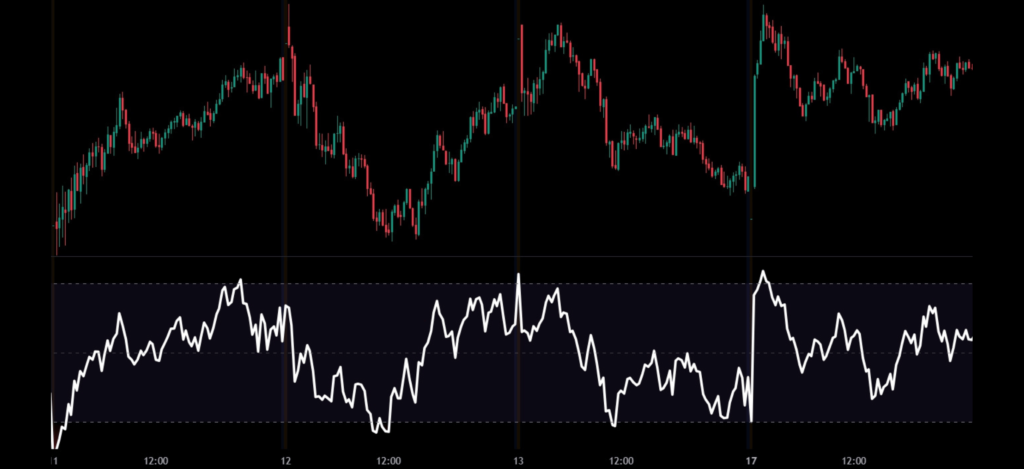
5. How RSI indicator Works ?
RSI indicator is displayed as a line graph that moves between 0 and 100. It measures the speed and magnitude of price changes and helps traders determine whether a market is gaining or losing momentum.
Here’s how it works in practice:
- If RSI rises above 70, the asset is in an overbought condition, which might indicate a price pullback.
- If RSI falls below 30, the asset is in an oversold condition, which might suggest a price bounce.
However, RSI does not always lead to immediate reversals. In strong uptrends, RSI can stay above 70 for long periods, and in strong downtrends, it can remain below 30 for an extended time.
To make RSI more effective, traders look beyond simple overbought and oversold signals and use additional RSI concepts.
Understanding 6 Key RSI indicator Concepts
Overbought and Oversold Levels
- Overbought (RSI above 70): When an asset reaches this level, it might be due for a correction. However, in strong uptrends, RSI can stay above 70 for extended periods.
- Oversold (RSI below 30): When an asset drops below this level, it might be due for a bounce. But in strong downtrends, RSI can remain below 30 for a long time.
Bullish and Bearish Divergence: RSI indicator
- Bullish Divergence: This occurs when the price forms a lower low, but RSI forms a higher low. It suggests that the downward momentum is weakening, and a potential trend reversal to the upside may occur.
- Bearish Divergence: This happens when the price forms a higher high, but RSI forms a lower high. It indicates that the upward momentum is weakening, and a potential downtrend could follow.
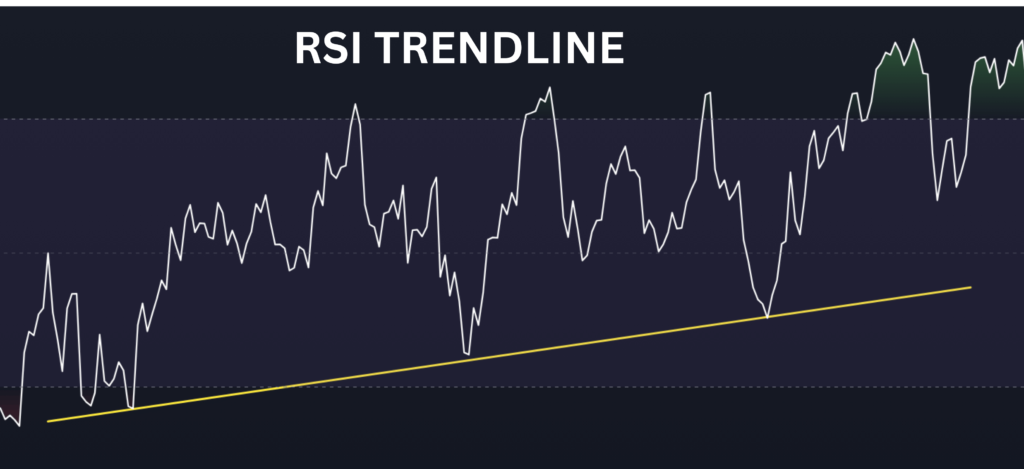
RSI Trendlines
Just as traders draw trendlines on price charts, they can also draw trendlines on the RSI indicator to detect shifts in momentum. If an RSI trendline is broken, it can signal a change in trend direction.
RSI Convergence
When RSI and price move in the same direction, it confirms the strength of the ongoing trend.
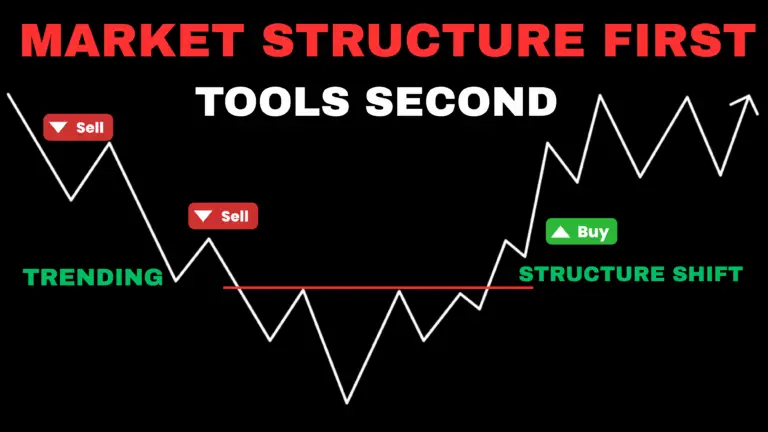
How to Use RSI in a Trending Market
RSI behaves differently in trending markets compared to range-bound markets.
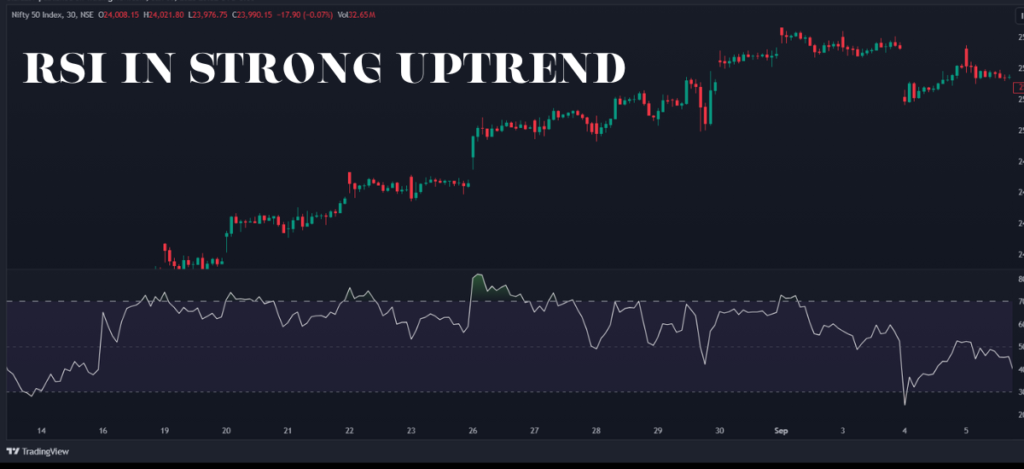
- In a strong uptrend, RSI can remain above 70 for an extended period without causing an immediate reversal. This does not necessarily mean the price will drop—it could indicate strong buying momentum.
- In a strong downtrend, RSI can stay below 30 for a long time. This does not always mean the price will rise immediately.
How to Trade RSI in a Trending Market?
- Draw RSI trendlines to identify momentum shifts.
- Look for RSI divergence to detect potential reversals.
- Combine RSI with moving averages to confirm signals.
When RSI Works Best (Personal Opinion)
In my personal experience, RSI works best in range-bound markets, where the price moves within a defined high and low range.
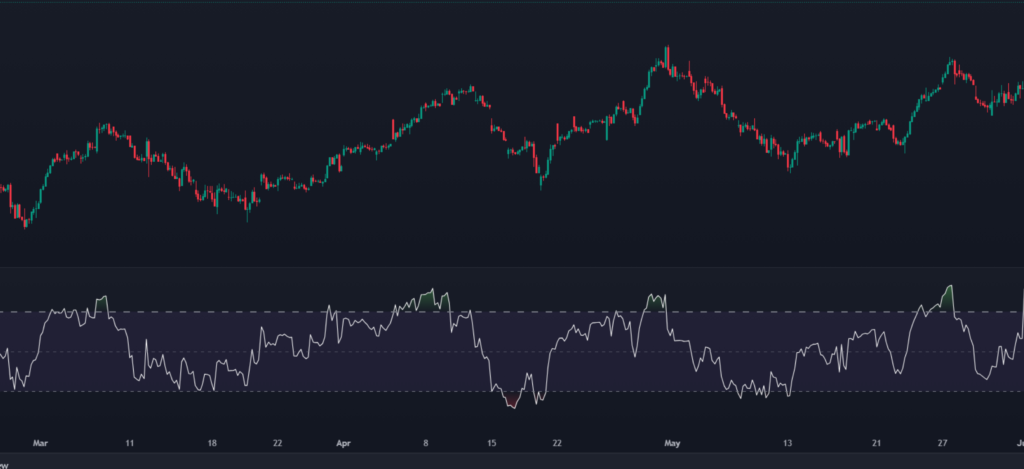
- In sideways markets, RSI can effectively indicate overbought and oversold conditions, making it useful for short-term trading.
- In trending markets, RSI alone can give false signals, so it should be used in combination with other indicators.
Every trader has a different approach, and RSI’s effectiveness depends on market conditions, asset type, and personal trading style.
Combining RSI with Other Indicators
RSI becomes even more powerful when used with additional technical tools:
- Moving Averages: Helps confirm if RSI signals align with the overall trend direction.
- VWAP (Volume-Weighted Average Price): Can validate RSI signals by showing whether price momentum aligns with volume strength.
- Volume Indicators: RSI measures price momentum, but adding volume data can help confirm whether a trend is truly gaining strength.
For example:
- If RSI signals overbought conditions, but volume remains strong, the trend may continue upward.
- If RSI signals oversold conditions, but volume increases, a strong reversal may be near.
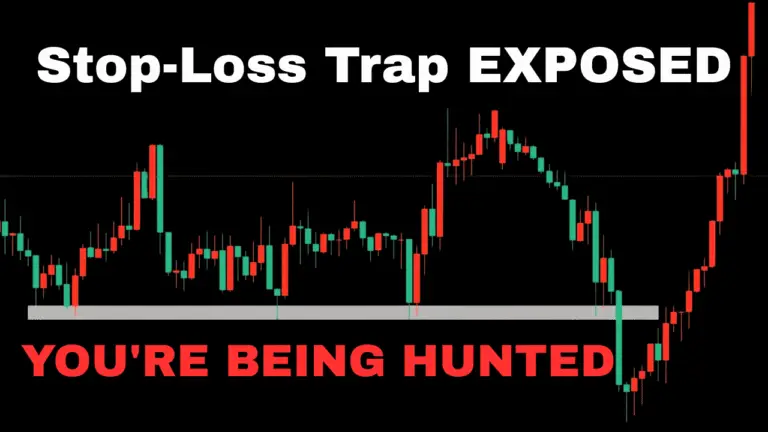
Limitations of RSI
While RSI is useful, it has some limitations:
- False signals: In strong trends, RSI can stay overbought or oversold for a long time, leading to premature trade entries.
- Lagging indicator: Since RSI is based on past price data, it does not always predict future movements accurately.
- Requires confirmation: It is always best to use RSI alongside other technical indicators rather than relying on it alone.
Conclusion
RSI is a valuable tool for traders looking to measure price momentum and identify potential reversals. However, it is important to remember that RSI settings are not fixed.
Different asset classes, such as stocks, forex, and commodities, cryptocurrencies, may require different RSI settings. While the default setting is 14 periods, traders should experiment with different timeframes to find what works best for their market.
Instead of using RSI alone, combine it with trend analysis, moving averages, VWAP, and volume indicators for greater accuracy and don’t forget to backtest different strategies.