Have you ever watched your perfectly placed stop-loss get triggered, only to see the market reverse immediately in your favor? You’re not alone—and it’s not coincidence.
Introduction: The Uncomfortable Truth About Stop-Loss Hunting
I’ve been there. You’ve been there. We’ve all experienced that sinking feeling when the market seems to have a personal vendetta against our trades. You place your stop-loss exactly where the textbooks tell you to, follow all the “rules,” and yet somehow, the market finds a way to hit your stop before reversing in the direction you originally predicted.
Here’s the uncomfortable truth: you’re not cursed, and you’re not unlucky. You’ve been hunted.
This isn’t about sharing tips or tricks. Instead, I’m going to expose the psychological and structural mechanisms that institutions—the real smart money—use to target retail traders like us. Not by chance, but by design.
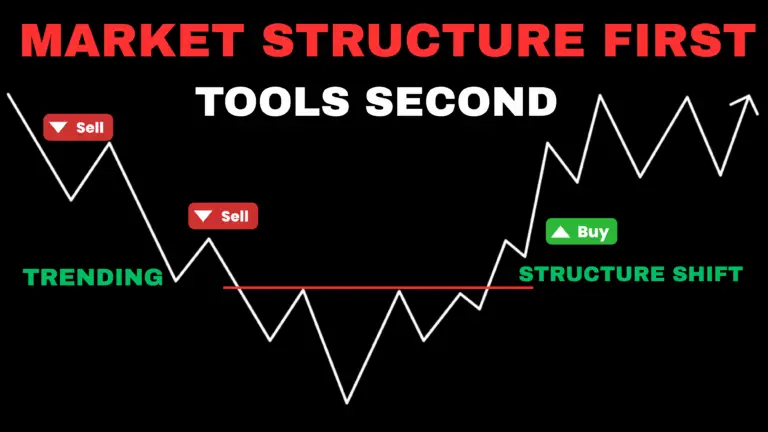
What Is Stop-Loss Hunting? Understanding the Monster
Stop-loss hunting is a deliberate price manipulation strategy where large institutions trigger the stop-losses placed by predictable retail traders. But why would they do this?
The answer is simple: your stop-loss is their liquidity.
Every stop-loss order you place is essentially a market order waiting to happen. When triggered, it becomes guaranteed execution at whatever price the market offers. For institutions managing massive positions, this represents a crucial source of liquidity they need to enter or exit their trades without causing significant price slippage.
The Mechanics Behind the Madness
When your stop-loss gets triggered, it immediately converts into a market order. This means you’re guaranteed to exit your position, but not necessarily at the price you expected. In volatile moments, this “protection” can quickly turn into a financial bloodbath.
Think of it like this: institutions push the market just enough to trigger clustered stop-losses, creating a cascade effect. Those stops become market orders, adding pressure in the same direction, which triggers even more stops. Meanwhile, institutions use this artificial liquidity surge to execute their own trades with precision and profit.
The Evolution of Stop-Loss Hunting: From Trading Floors to Algorithms
The Early Days
This strategy isn’t new. Long before algorithmic trading existed, big institutions and brokers on trading floors would observe price levels where retail traders commonly placed their stops. They’d watch for patterns around obvious support levels and round numbers.
All it took was a few large sell orders to push prices down, hit those stops, and trigger a wave of selling. That flood of orders provided the liquidity they needed, and just like that, they’d buy in at the lows and ride the price back up.
The Modern Arms Race
Fast forward to today, and stop-loss hunting has evolved into a sophisticated game. With high-frequency trading, advanced algorithms, and real-time data analysis, institutions don’t just guess where stops are—they know.
They map out liquidity zones, hunt clusters, and execute with surgical precision. As retail traders, we can’t rely on fixed rules anymore. Markets are constantly evolving, and we need to stay one step ahead.
Why Stop-Loss Hunting Devastates Retail Traders
The Emotional Toll
Stop-loss hunting doesn’t just affect your trading account—it plays havoc with your emotions. When your stop gets hit, especially right before the price moves in your favor, it triggers frustration, doubt, and anger.
This emotional response often leads to:
- Revenge trading to get your money back
- Jumping back into trades without proper analysis
- Chasing moves you almost caught
The Long-Term Damage
After getting stopped out repeatedly, many traders start reacting emotionally in the long term. Some widen their stop-losses too much, trying to “play it safe,” but this actually increases their risk. Others stop using stop-losses altogether—a recipe for account destruction.
The real damage isn’t just the money lost—it’s the mental toll and the destruction of your discipline and risk management system. Once you lose confidence in your own trading methodology, it’s easy to spiral into jumping between strategies, ignoring rules, and stacking up bad decisions.
The Anatomy of Stop-Loss Hunting: How It Actually Works
Understanding Stop-Loss Order Mechanics
Stop-loss orders are designed to protect you. They’re automatic instructions to your broker to sell your position if the price drops to a certain level (for longs) or buy back if the price rises to a certain level (for shorts).
However, once the trigger price is hit, the stop converts into a market order. This guarantees you’ll exit the trade but not necessarily at the price you expected—that’s called slippage. In fast-moving markets, this slippage can significantly increase your losses.
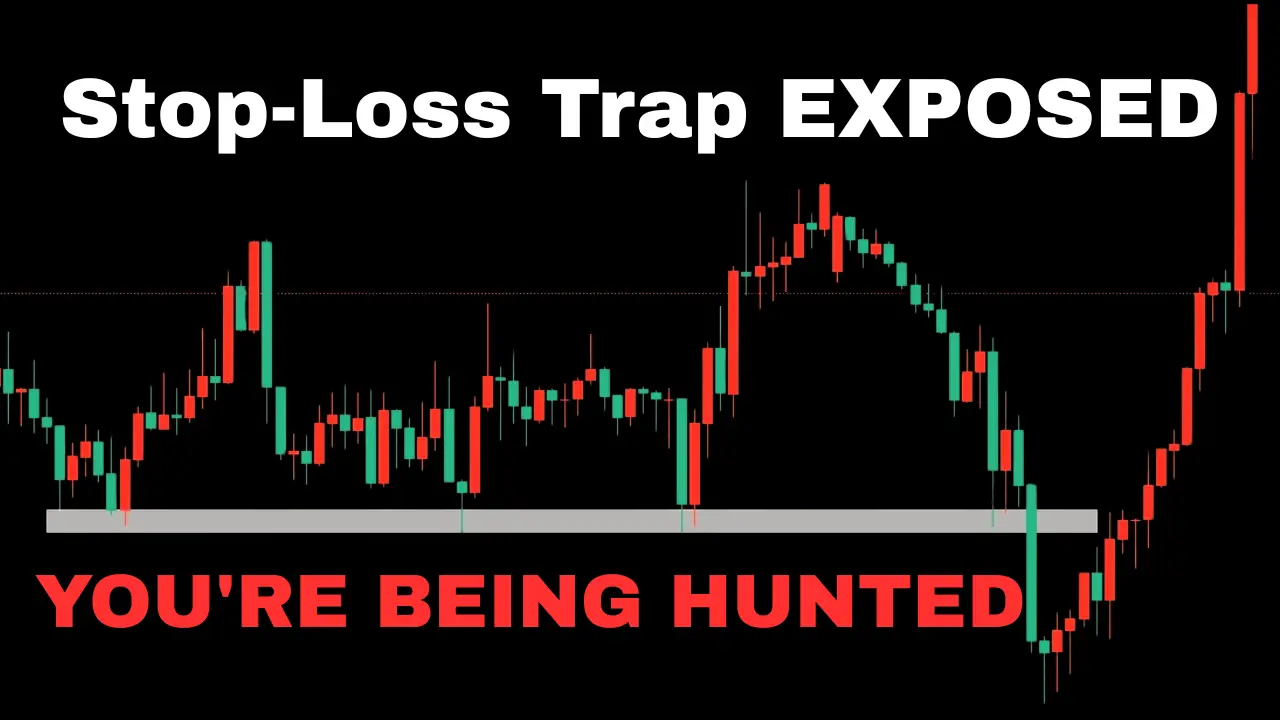
The Domino Effect
Here’s where it gets really interesting. When a big player nudges the market just enough to trigger a few stops, those stops become market orders, adding more pressure in the same direction. This triggers more stops, creating a cascade effect.
What started as a targeted move quickly turns into a full-blown sweep. Prices move fast, liquidity floods in, and volatility spikes. While you’re thinking it’s random market movement, institutions are using that surge to enter or exit positions with precision.
Where Stop-Loss Clusters Form: The Predictable Zones
Most retail traders, without realizing it, tend to place their stops in the same predictable locations. This isn’t because we’re copying each other—it’s because we’re all taught the same principles from books, courses, and educational content.
1. Support and Resistance Levels
These are the most obvious zones. Traders think: “If price breaks below support, the trend is invalid… I’ll stop out there.” But since everyone sees the same support zone, the area just below it becomes a liquidity pool.
Institutions know this pattern and often push price slightly below support to grab those stops before reversing the market back up.
2. Swing Highs and Lows
Recent peaks and troughs act as visual anchors. Retail traders commonly place stops:
- Below recent lows in long trades
- Above recent highs in short trades
Since these points are obvious to everyone, institutions often probe these levels with just enough pressure to trigger stops and collect liquidity.
3. Round Numbers
The psychological power of round numbers cannot be understated. Prices like 10,000, 50,000, or even 100 feel important to us. Traders assume these are strong barriers and place stops just before or after them.
However, round numbers attract attention and orders, making them prime targets for manipulation. Big players frequently drive prices just beyond these levels to trigger stops before reversing.
4. Breakout Zones
When price consolidates in a range, retail traders wait for the breakout. Some place entry orders above resistance or below support, while others place stops nearby in case of a false breakout.
Institutions see this setup and often fake the breakout, sweeping both sides and leaving traders positioned incorrectly. It’s a classic manipulation tactic.
5. Arbitrary Pip Distances
Some traders don’t use any structural analysis at all. They’ll place stops at fixed distances—50 pips below entry or 100 points above a level—regardless of actual price action or volatility.
These arbitrary stops are easy prey because they don’t respect how the market actually moves.
The Institution’s Playbook: Tools and Tactics
Strategic Liquidity Management
For institutions—hedge funds, banks, and proprietary trading firms—hunting stops isn’t emotional or malicious. It’s strategic business.
These players manage orders so large that simply entering or exiting positions without proper liquidity would move the market against them. When you’re managing tens of millions in exposure, slippage isn’t a minor inconvenience—it’s a threat to profitability.
The Technology Behind the Hunt
While institutions don’t fully disclose their trading infrastructure, we can piece together their capabilities through observation and regulatory disclosures:
Publicly Available Tools:
- Level 2 Data/Order Book Depth: Provides real-time bid and ask sizes
- Cumulative Volume Delta (CVD): Tracks aggressive buying versus selling
- Footprint Charts & Volume Profiles: Show where volume is actually traded
- Liquidity Heatmaps: Visualize where orders are likely resting
Institutional-Level Infrastructure:
- High-Frequency Trading (HFT): Co-located servers execute trades in microseconds
- Smart Order Routing: Algorithms slice large orders into smaller fragments
- Internal Liquidity Models: Decades of data to predict trader behavior
- Dark Pools: Off-exchange trading invisible to retail traders
Legal and Illegal Tactics
Illegal Methods (But Still Occurring)
Spoofing: Placing large limit orders to create false impressions of demand, then canceling them before execution.
Layering: Repeatedly placing and canceling orders at different levels to simulate market depth.
These tactics are illegal in many jurisdictions, with firms facing hundreds of millions in fines. However, in fast, fragmented markets, some of these practices still occur.
Legal but Effective Methods
Iceberg Orders: Display only portions of large orders, hiding true size from the market.
Liquidity Absorption: Gradually executing massive orders at key levels without creating visible imbalances.
False Breakouts: Pushing price just beyond technical levels to trigger stops and breakout entries simultaneously.
The Role of Liquidity in Stop-Loss Hunting
High-Liquidity Environments
In markets like the S&P 500, Apple, or major forex pairs, there’s plenty of volume and tight spreads. While this sounds safe, it actually creates predictable behavior patterns.
Retail traders place stops at obvious levels, creating liquidity clusters that institutions can easily identify and target. A large player can aggressively sell to push price below support, trigger retail stops, then buy into that wave of selling to fill their position at a discount.
Low-Liquidity Scenarios
During off-hours trading, in illiquid assets, or around major news events, it takes much less capital to move prices significantly. This makes these environments ideal for stop-loss hunts.
Institutions can trigger cascades with minimal resistance and cause disproportionate movements with less effort. You’ll often see flash wicks and sharp reversals during these periods.
Liquidity Grabs vs. Sweeps
Understanding the difference helps decode institutional intent:
Liquidity Grab: A surgical, quick move into a known cluster of stops, followed by immediate reversal.
Liquidity Sweep: A broader, more aggressive move through several layers of orders, often with high volume.
Both are manipulation tools, but grabs typically signal reversals while sweeps may clear the path for larger directional moves.
Strategies to Survive and Thrive
Understanding VWAP: The Institutional Compass
The Volume Weighted Average Price (VWAP) isn’t just another indicator—it’s how institutions navigate the market. VWAP represents the average price an asset has traded at throughout the day, weighted by volume.
When price trades far above VWAP, institutions often see it as overbought. When it trades far below, it may be undervalued. Retail traders who chase price far from VWAP often find themselves caught in traps.
Smart Stop-Loss Placement
Instead of using obvious levels, try these approaches:
Structure-Based Logic: Use the Average True Range (ATR) to assess typical price movement. Place stops at 1.5 or 2 times the ATR to give trades room to breathe.
Volatility-Based Adjustments: When volatility spikes, slightly widening stops may protect against premature exit, but always balance this against risk-reward ratios.
Split Stop Strategy: If you must place stops at popular levels, split them. Place part at the logical technical zone and the rest slightly beyond.
Execution Considerations
Stop-Market Orders: Guarantee execution but may fill at terrible prices during fast moves.
Stop-Limit Orders: Provide price control but risk not being executed at all.
Mental Stops: Manually watched stops that avoid being hunted, but require intense emotional discipline.
Reading Institutional Footprints
Watch for these signs of manipulation:
- Sudden wicks piercing key levels
- Explosive volume spikes
- Rejections that seem too perfect
- Order blocks and fair value gaps
The key is patience. Don’t chase. Let the manipulation finish, wait for the sweep to happen, then participate once the reaction confirms the trap.
Risk Management Mindset
Never risk more than a small percentage of your capital on a single trade. This isn’t about winning today—it’s about surviving to trade tomorrow.
Diversification and hedging can protect your portfolio, but the most effective hedge is your mindset. Stop thinking like prey and start thinking like the hunter.
The Market-Wide Impact
Increased Volatility
Stop-loss hunting generates artificial price acceleration, creating sharp reversals and fake breakouts. This forces traders to widen stops and take on more risk, often playing right into institutional hands.
Distorted Price Discovery
When manipulation distorts natural supply and demand, markets struggle to find fair value. This rewards trickery over rational decision-making and undermines market efficiency.
Systemic Risks
In extreme cases, stop-loss hunting can trigger chain reactions leading to flash crashes. The damage extends beyond individual trades to overall market confidence and stability.
Building Your Anti-Hunting Arsenal
Technical Analysis Tools
- Volume profile analysis to identify accumulation and distribution zones
- Footprint charts to see actual order flow
- Liquidity heatmaps to visualize potential stop clusters
- Smart money concepts like order blocks and fair value gaps
Behavioral Adaptations
- Think like institutions: Ask where smart money expects retail stops to be placed
- Use confluence: Combine multiple factors before placing stops
- Practice patience: Let the market come to you rather than chasing
- Maintain discipline: Stick to your risk management rules regardless of market action
Continuous Improvement
- Backtest your strategies to understand their effectiveness
- Keep a trading journal to track patterns and improvements
- Study market rhythm around VWAP and key levels
- Learn from manipulation by turning predictable patterns into opportunities
Conclusion: From Prey to Predator
The world of trading is a battlefield where knowledge is your only real edge. You’ve now seen behind the curtain—you understand how institutions think, how they hunt, and how they move markets with precision.
Remember, the goal isn’t to beat smart money at their own game—it’s to stop playing the game blind. By understanding liquidity dynamics, stop-loss exploitation, and how to position yourself outside the obvious zones, you transform from target to tactician.
Trading will always be challenging, but now you’re not just reacting—you’re anticipating. You’re informed, intentional, and evolving. That shift from reactive to proactive trading is the beginning of real power in the markets.
The institutions will continue their hunt, but you no longer have to be their prey. Stay sharp, stay strategic, and never trade like prey again.